Project Overview: I spearheaded an optimization project for ULINE’s distribution network aimed at reducing delivery times and improving service coverage. By analyzing the company’s warehouse locations and delivery routes, I identified opportunities to enhance efficiency, leading to a 20% reduction in delivery time.
Key Contributions & Approach:
- Conducted in-depth analysis of warehouse assignments and customer locations, utilizing Python, Tableau, and the Gurobi Optimizer to evaluate potential improvements.
- Incorporated new data points, such as geodesic distance, to ensure precise transit time calculations while excluding invalid areas, including locations with zero population.
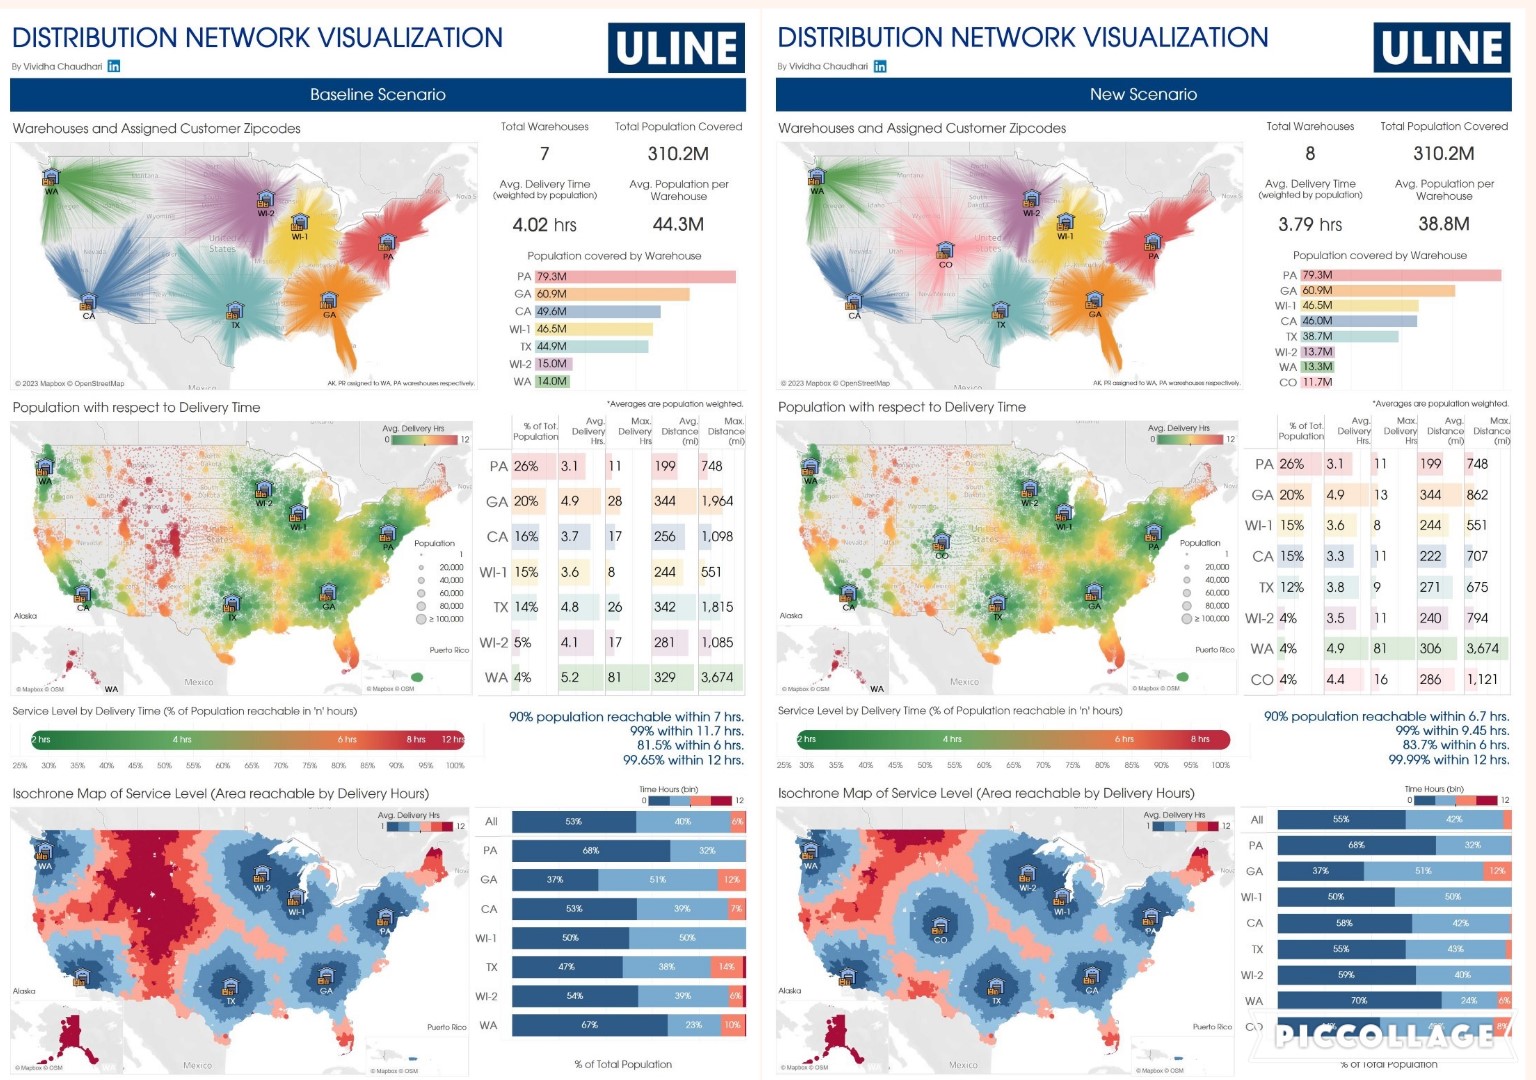
- Created a detailed Tableau dashboard to visualize the results, showcasing the impact of adding a new distribution center on delivery efficiency and service coverage.
- Delivered actionable insights that contributed to faster delivery times and an improved customer experience, with a decrease in delivery time to 3.79 hours.
Results:
- Optimized ULINE’s distribution network, enhancing overall service levels and coverage.
- Demonstrated the power of data-driven decision-making in logistics, ultimately achieving operational cost savings and increasing customer satisfaction.
Skills Utilized:
- Python (for analysis and optimization modeling)
- Gurobi Optimizer (for solving the optimization problem)
- Tableau (for data visualization and reporting)
- Github Copilot (for code assistance)